
 Melky
Melky 
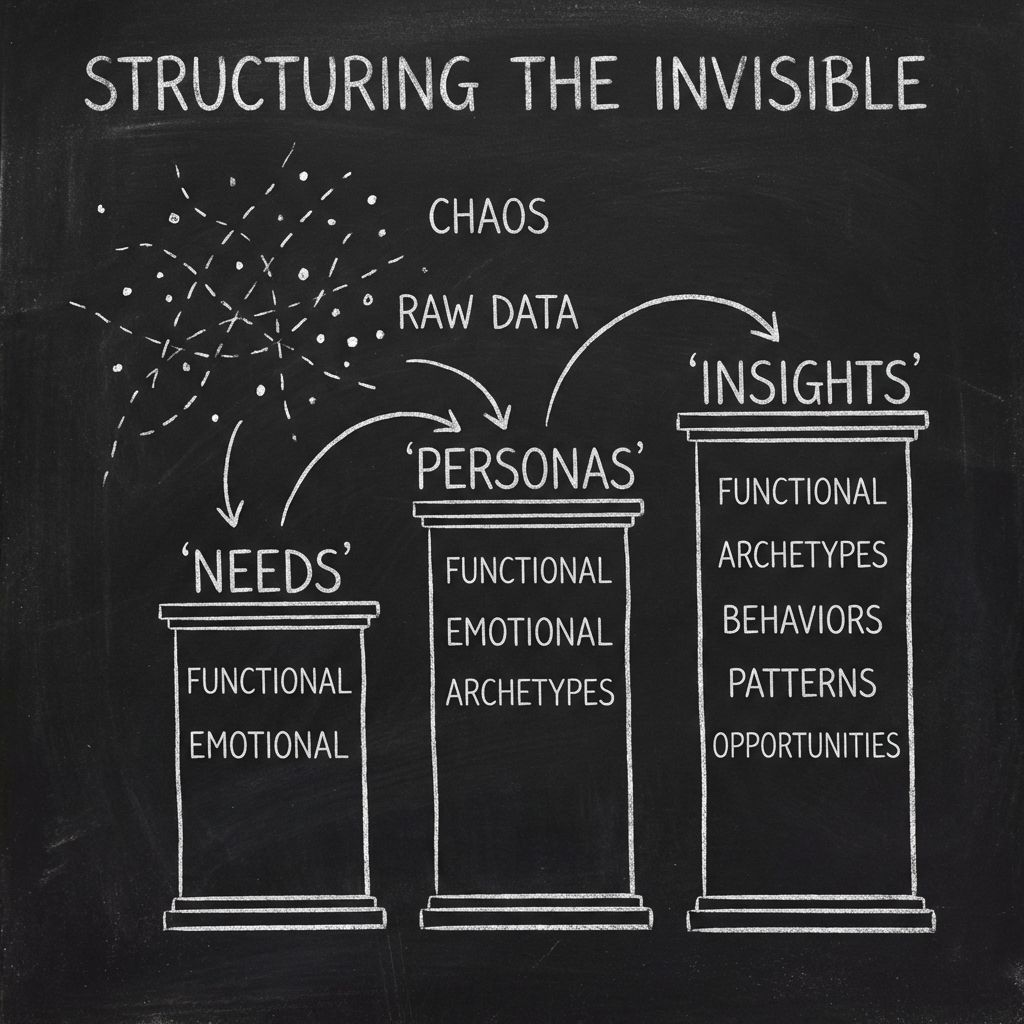
Structuring the invisible: The content pillar protocol
In the Hallucination Gap, we established that an AI cannot “see” quality without a predictive filter. But once you have filtered the high-performing content, what do you do with it?
Data handlers in performance marketing are overwhelmed. They face “always-on” environments with thousands of transient creative assets.
A Facebook ad for a car-hailing app might mention “saving time,” “business expenses,” and “comfort” all in one sentence. To make this data actionable, we must decompose it.
We need a protocol for Structuring the Invisible. The SOMONITOR framework proposes a method to convert unstructured ad copy into a structured database of “Content Pillars.” The paper claim the semantic extraction using a sophisticated pipeline of LLM retrieval and embedding clustering.
The content pillar protocol
The core innovation of the SOMONITOR framework is the shift from “ad-level” analysis to “pillar-level” analysis. Instead of analyzing an ad as a monolithic block of text, the system breaks it down into atomic units of meaning.
1. Deconstruction: The semantic extraction
The system starts by employing an LLM to “rip apart” each high-performing ad into core components.
The researchers utilized a custom Prompt Engineering strategy where the LLM acts as a forensic analyst. It is asked to identify specific, well-defined insights:
- Customer Needs: What explicit problem is being solved? (e.g., “Efficient transport”, “Cost control”)
- Product Features: What is the mechanism of the solution? (e.g., “Corporate billing dashboard”, “Scheduled rides”)
- Insights: What is the emotional or psychological hook? (e.g., “Frustration with reimbursement paperwork”)
These become the Content Pillars. Suddenly, you are not analyzing “ads”; you are analyzing “needs.”
In their experiments, the researchers processed thousands of ads and found that while the raw text varied wildly, the underlying pillars were remarkably consistent.
An ad about “rushing to a meeting” and an ad about “late-night airport rides” might both map to the same Customer Need: Time Reliability.
2. Clustering the Chaos: X-Means on ADA Embeddings
Once you have extracted these thousands of “needs” and “insights,” you face a new problem: duplicate and overlapping concepts. You might have 500 different ways of saying “save money.”
To solve this, the framework employs X-Means Clustering on valid text embeddings.
The Technical Stack
-
Embeddings: The text of each extracted pillar is converted into a high-dimensional vector using the ADA model (specifically
text-embedding-ada-002). This captures the semantic meaning of the text, ensuring that “cost effective” and “cheap” are positioned closely together in vector space. -
X-Means Algorithm: Unlike standard K-Means clustering, where the human must guess the number of clusters () in advance, X-Means efficiently estimates the optimal number of clusters automatically.
-
Bayesian Information Criterion (BIC): The algorithm uses BIC values to determine when to stop splitting clusters. It balances model complexity with fit, ensuring you don’t end up with too many micro-clusters or too few broad blobs.
In the study, they ran X-Means with a range of , allowing the data itself to define the architecture of the market.
3. Case Study: Gojek vs. Grab (B2B Singapore)
To prove the efficacy of this protocol, the researchers conducted a massive empirical study on the B2B ride-hailing market in Singapore, analyzing two major competitors: Gojek and Grab.
The Dataset
- Timeframe: 2023 - 2024
- Total Content: 5,967 pieces (3,703 Ads, 2,264 Organic posts)
- Focus: 1,120 Ads specifically related to B2B products.
- Split: Gojek (76.8% of content), Grab (23.2%).
The Discovery: Persona Clusters
By running the clustering protocol on this dataset, the system identified three distinct Persona Clusters hidden within the chaos:
- Efficiency Enthusiasts (Persona 1): This group cares about speed, turnover, and logistics. They are pragmatic operational managers.
- Financial Empowerment Champions (Persona 2): This group is distinct. They focus on employee benefits, cost control, and the “empowerment” of their staff through better tools.
- Efficiency Innovators (Persona 3): Similar to group 1, but focused on novelty and new tech solutions rather than just traditional speed.
The Semantic Map
By mapping the competitor’s content against these clusters, the researchers revealed the Invisible Index. They could see exactly which psychological buttons were being pressed.
The analysis revealed a critical strategic gap:
- Grab was heavily leveraging Persona 1 (Efficiency Enthusiasts). Their content was dominated by messages of speed and logistics.
- Gojek had a massive opportunity in Persona 2 (Financial Empowerment). This persona was under-served by the competitor.
Furthermore, they analyzed “Communication Themes” (Challenges). They found that “Challenge 3: Streamlining Work Transport Processes” was frequently addressed by Grab but almost ignored by Gojek.
Turning intuition into engineering
This is the power of the protocol. It turns “creative intuition” into engineering specs.
Instead of a creative director guessing that “we should talk about efficiency,” the X-Means algorithm provides a mathematical proof that “Efficiency Innovators” is a distinct, addressable cluster with specific semantic boundaries.
My views: The danger of the centroid
We must apply a critical lens to this “clustering” approach. In data science, a cluster is defined by its Centroid, the mathematical average of all points in the group.
The average is the enemy in growth marketing.
The “Efficiency Enthusiast” persona, identified by X-Means, is, by definition, the most generic version of that customer. It strips away the edge cases, the weird outliers, and the passionate fringes. Yet, often these “fringes” drive the highest LTV (Lifetime Value) and viral referral, in my experience.
When you engineer your pillars around the centroid, you guarantee “Product-Market Fit” but you risk “Product-Market Bore.”
You become perfectly acceptable to everyone, and essentially indispensable to no one. Use the pillars as a foundation, but do not let them become a ceiling.
This structured data fuels the final stage of the pipeline. Once we have the Persona (Who) and the Challenge (What), we can use Generative AI to create the Story (How). This leads us to The Algorithmic Brief.
Share Article
If this article helped you, please share it with others!
Some content may be outdated